
Had an epiphany today in a discussion about Social Security.
We are all familiar with this graph, right?
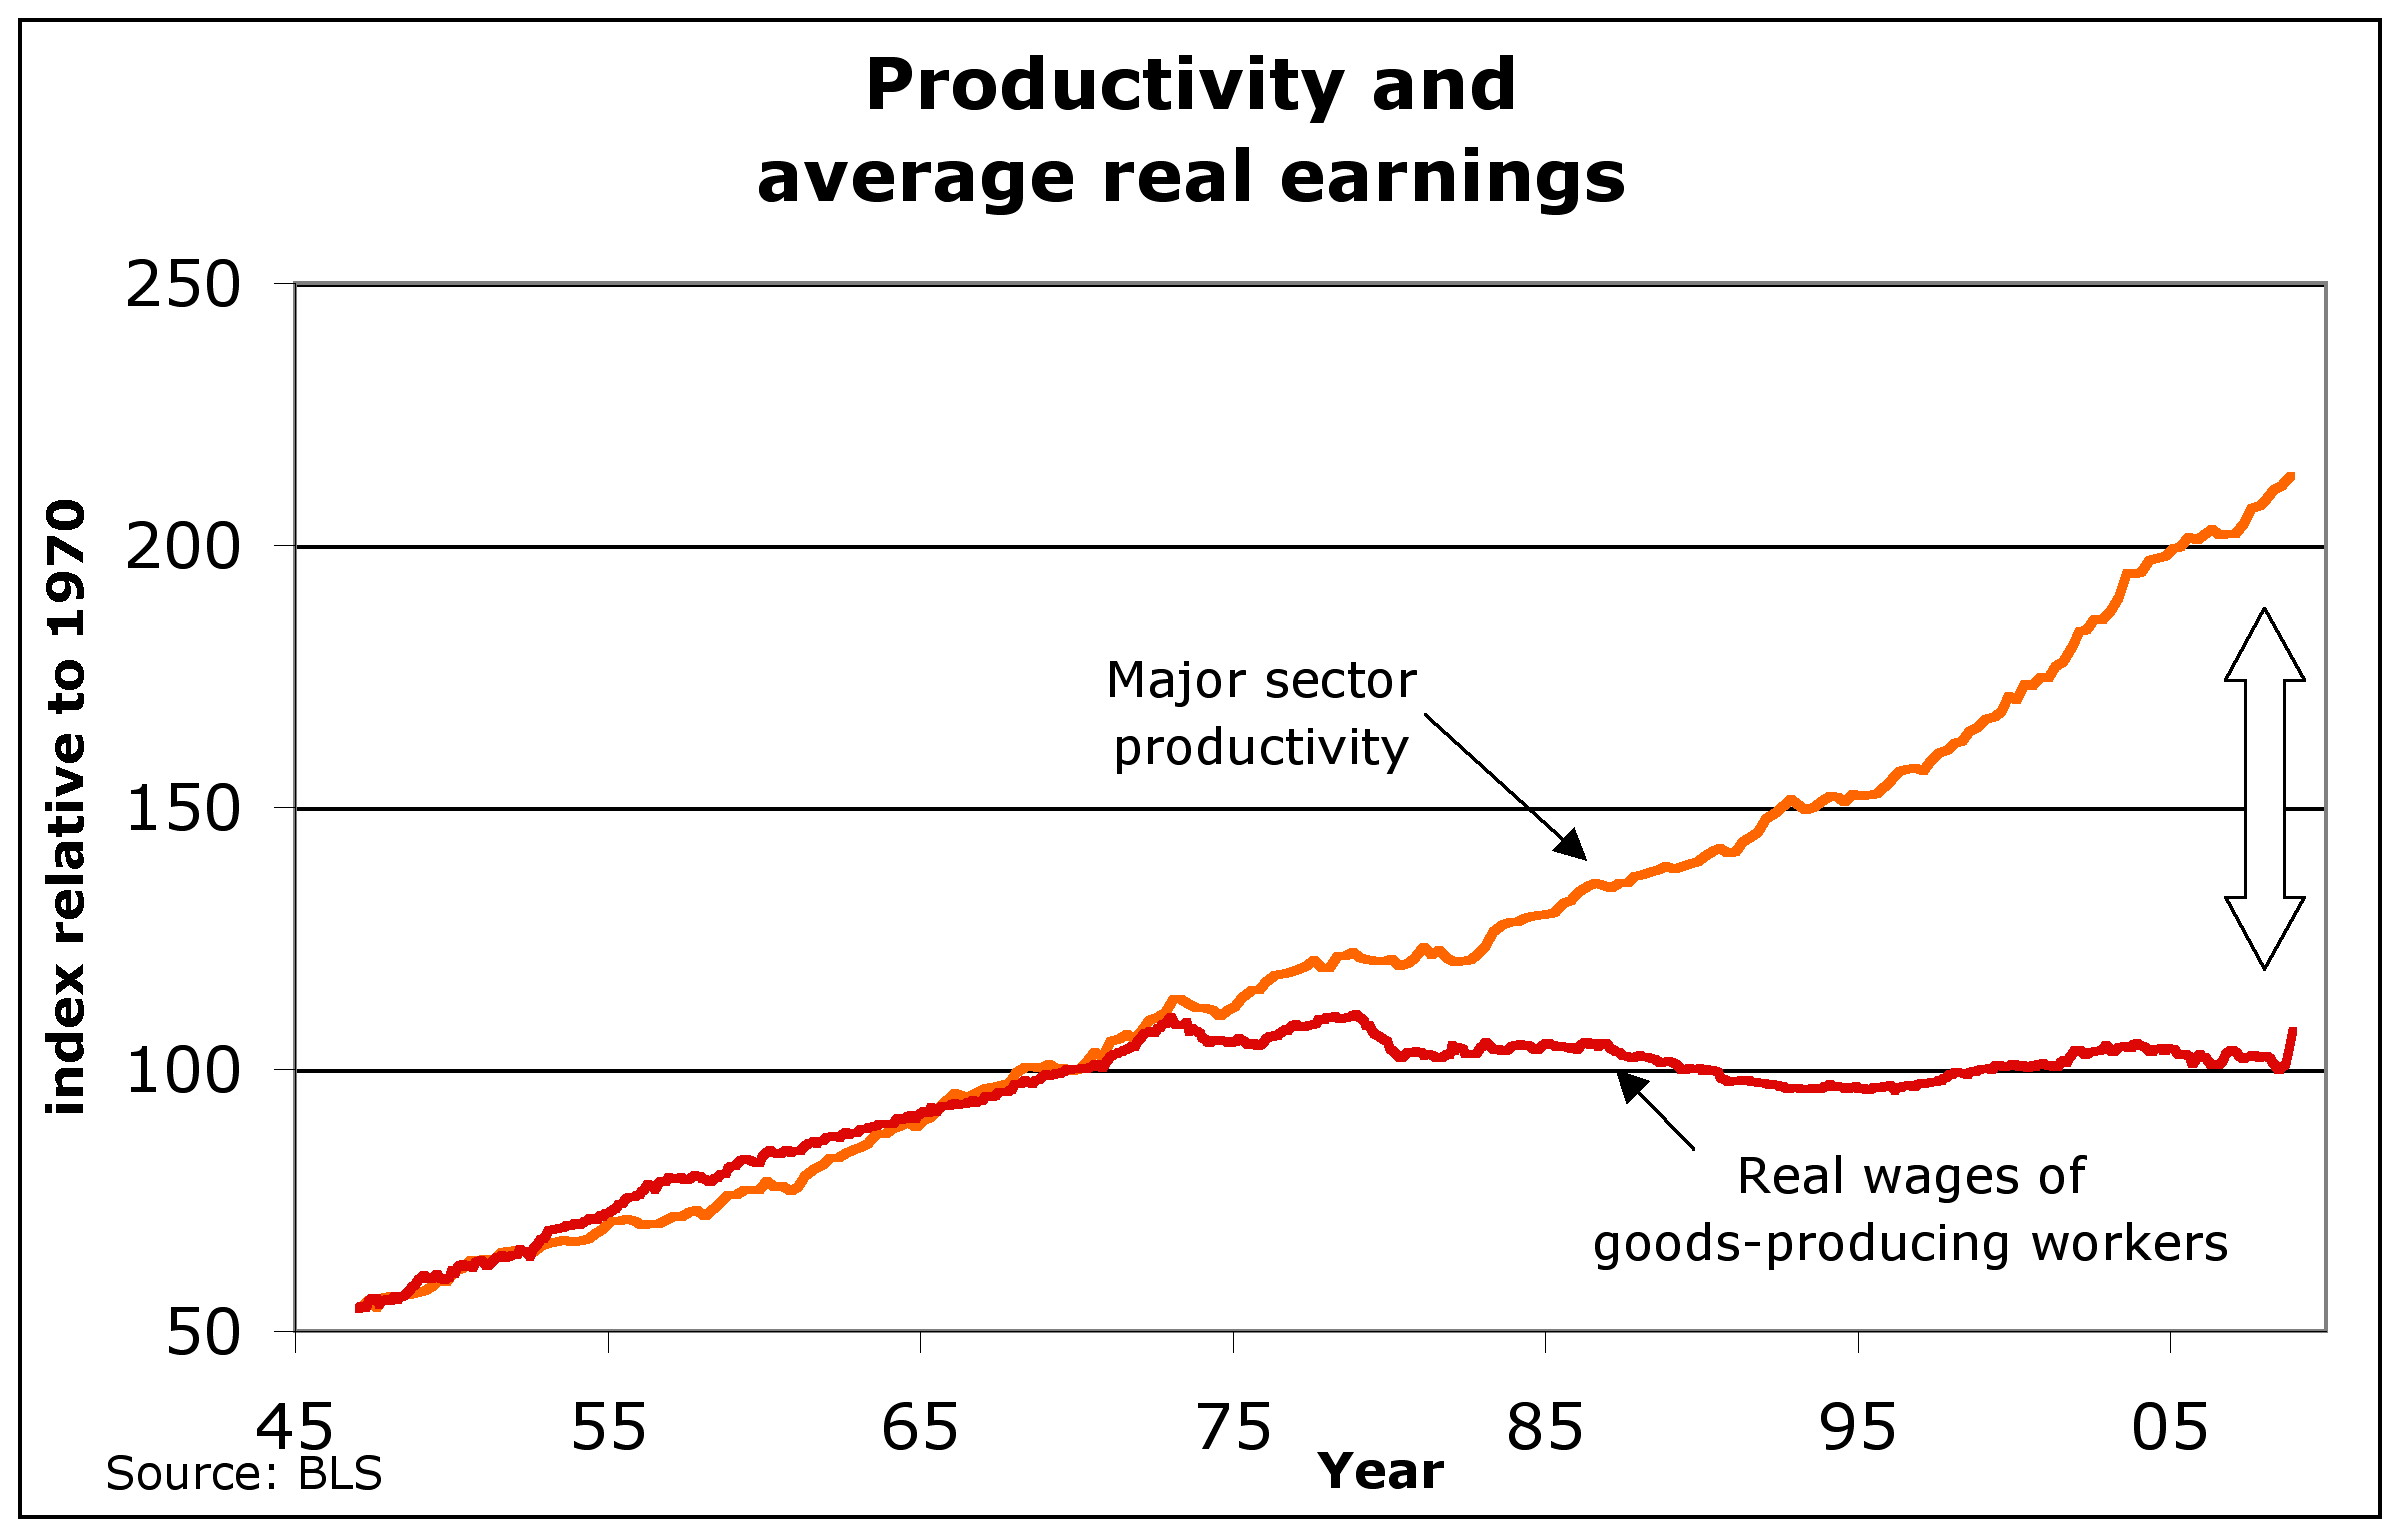
So somewhere around 1973 (probably caused by my birth), wages stagnated as productivity continued to climb. We all know where that money went: into the pockets of the folks at the top.
In 1973, the minimum wage was $1.60 per hour and the Social Security Maximum Taxable Earnings was $10,800 per year, or about $5.19 in hourly full-time equivalents-- exceeding the minimum wage by a factor of 3.2. Interestingly, the median individual income in 1974 (not sure why the Census table stops there) was $5,335, so the cap was at approximately twice the median. (The cap applies to individual income, not to household income.)
As income accrued to the higher end of the bracket, often not even as wages, but as capital gains, it was not taxed for Social Security. This has been going on for more than FORTY YEARS.
Consider, for a moment, that if over the last ~44 years, this money had been going into our pockets and taxed for Social Security at a rate ranging from 5.85% (in 1973) to 6.2% (now), how much more money would currently be in the trust fund.
This is money they stole from ALL OF US. Not just in our wages, but in our long-term security.
I thought I was already angry....